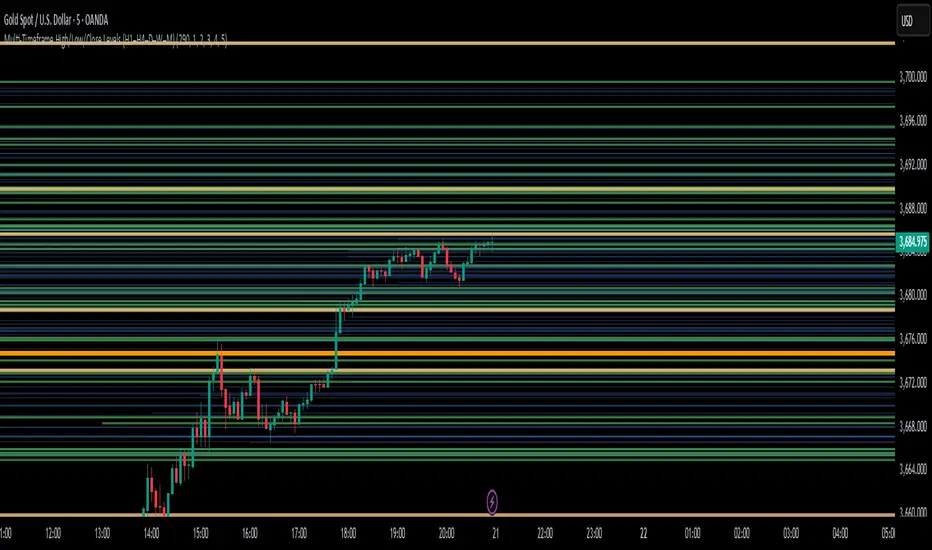
Multi-Timeframe High/Low/Close Levels (H1–H4–D–W–M)This indicator plots multi-timeframe levels (High, Low, Close) for the following periods:
H1 (1-Hour)
H4 (4-Hour)
Daily (1-Day)
Weekly (1-Week)
Monthly (1-Month)
Key Features:
Draws High, Low, and Close levels for each timeframe.
Each level starts from its own candle and extends to the right.
Levels are filtered to stay close to the current price, keeping the chart clean.
Automatic line management ensures that the total number of levels never exceeds the user-defined limit (default: 300, adjustable up to 400).
Customizable colors, widths, and visibility for each timeframe in the Style tab.
Usage:
Use these levels as dynamic support and resistance zones.
Higher-timeframe levels are drawn with stronger colors and thicker lines, giving visual priority over lower-timeframe levels.
Pesquisar nos scripts por "high low"
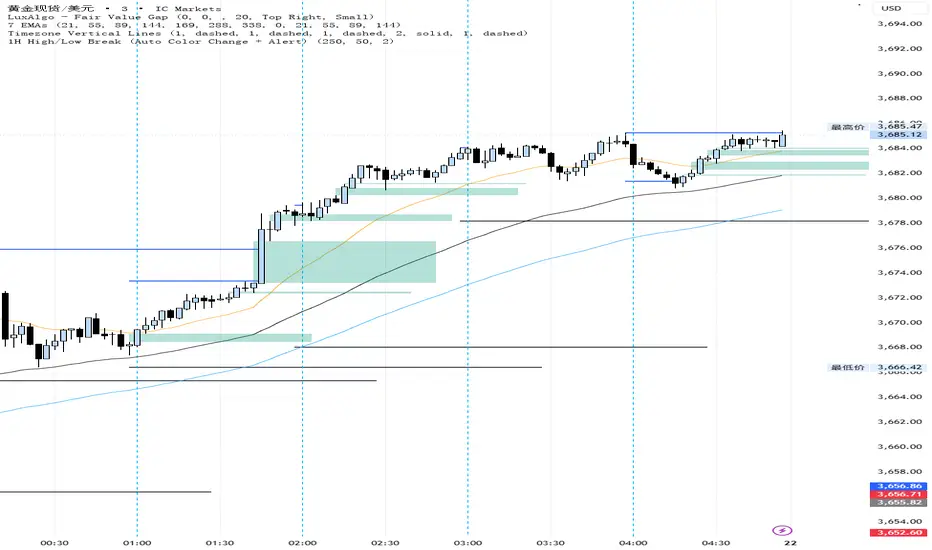
1H High/Low Break (Auto Color Change + Alert)1H High/Low Break (Auto Color Change + Alert)
Automatically plot hourly highs and lows, with the black line turning blue upon a breakout. Set an alarm to alert you when a breakout occurs, saving you considerable effort.
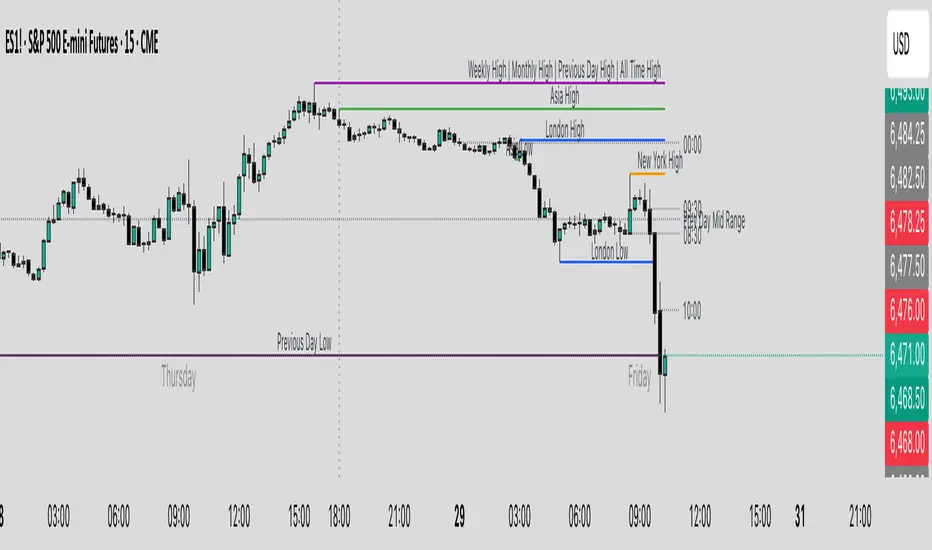
Sessions Highs/LowsThis indicator plots the High and Low of the three main trading sessions:
Asia (20:00–03:00) – green lines
London (03:00–08:00) – blue lines
New York (08:00–13:00) – red lines
Features:
Levels update in real time during each session.
When a new session starts, the previous lines are deleted – only the latest active sessions remain visible.
Default session times are set to Asia (20:00–03:00), London (03:00–08:00), and New York (08:00–13:00), but you can adjust them to your own custom hours in the settings.
Colors can also be customized.
Use cases:
Quickly visualize session ranges.
Track session highs/lows for breakouts, fakeouts, and reactions around liquidity zones.

NX - ICT LiquidityThis indicator identifies liquidity zones based on ICT concepts, highlighting swing highs (BSL) and swing lows (SSL) with dynamic detection and mitigation logic. It also plots key institutional levels from the previous day, week, and month—including High, Low, Open, and Close—customizable by timeframe.
Designed for precision and clarity, it helps traders visualize potential sweep setups and reaction points with minimal chart clutter.

Renko Trend Indicator with High/LowRenko Trend Indicator with High/Low
Version: 1.0
Pine Script Version: 5
Type: Indicator
Overlay: Yes
Description
The Renko Trend Indicator with High/Low provides a visual representation of market trends using Renko-style calculations based on either a fixed brick size or ATR (Average True Range). It helps traders identify trend direction, potential reversals, and key support/resistance levels.
The indicator plots Renko-based trend signals directly on your chart and provides a colored Renko close line, making trend analysis simpler and clearer.
Features
Customizable Renko Brick Size
Fixed brick size or dynamic ATR-based bricks.
Step input for precise control over brick size.
Trend Identification
Detects uptrend and downtrend based on Renko logic.
Plots visual signals for trend direction:
Green triangle below bars → Uptrend
Red triangle above bars → Downtrend
Renko Close Line
Shows the Renko-adjusted closing price as a line.
Line color changes with trend (green for uptrend, red for downtrend).
Inputs
Name Type Default Description
Brick Size float 50 Size of Renko bricks (price units)
Use ATR for Brick Size? bool false Enable ATR-based dynamic brick sizing
ATR Period int 14 Number of periods for ATR calculation if enabled
How It Works
The indicator calculates Renko bricks using either a fixed size or ATR.
It maintains internal variables:
renko_close → Current Renko price
renko_high → Highest point of the current trend
renko_low → Lowest point of the current trend
trend → Current trend direction (1 for uptrend, -1 for downtrend)
last_extreme → Last extreme point to detect trend reversal
When price moves above or below the Renko threshold, the trend is updated.
Trend signals are plotted on the chart for easy visualization.
Plots
Plot Name Description Color
Up Trend Triangle below bar when trend is up Green
Down Trend Triangle above bar when trend is down Red
Renko Close Line connecting Renko-adjusted close prices Green (up) / Red (down)
Usage
Add the indicator to any chart with your preferred timeframe.
Configure the brick size or enable ATR-based bricks for dynamic calculation.
Observe the trend triangles and Renko line to identify trend direction and potential reversals.
Can be used in combination with other indicators or strategies for trading decisions.
Notes
This indicator is for analysis purposes only and does not place trades automatically.
ATR-based bricks adapt to market volatility, while fixed bricks provide a static reference.
Works best on liquid markets with regular price movements.
Example Chart
Green triangles below bars signal a buying trend.
Red triangles above bars signal a selling trend.
The colored Renko line shows the trend progression visually.
Author
DB
Pine Script Version: 5
License: MIT

Key Levels & Session Highs/Lows by OdegosProfessional multi-timeframe support and resistance level indicator that automatically tracks and displays key price levels across different trading sessions and timeframes.
🎯 What it shows:
Session Open - Daily market open reference line
Asia & London Sessions - High/low levels from major trading sessions
Previous Day - Yesterday's actual high and low levels
Weekly & Monthly - Higher timeframe support/resistance levels
⚡ Smart Features:
Auto-combines overlapping levels with merged labels
Break detection - Lines stop when price breaks through (optional)
Timezone support - Works with any global timezone
Universal colors - Optimized for both light and dark chart themes
Clean interface - Organized settings with intuitive dropdowns
🛠️ Fully Customizable:
Individual show/hide toggles for each level type
Custom colors, line styles, and widths
Adjustable label text and positioning
Global text color override option
Perfect for day traders, swing traders, and anyone who relies on key support/resistance levels for market analysis.
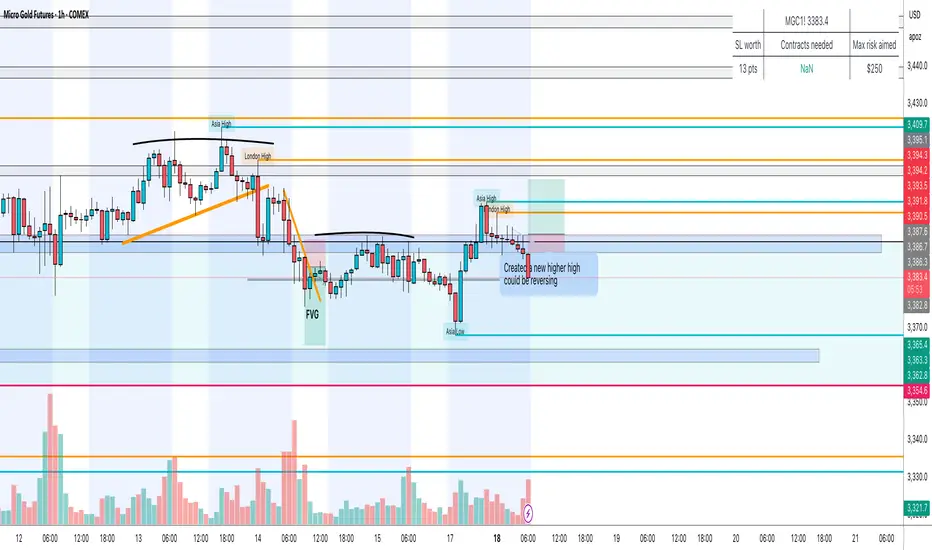
Session High/Low Sweeps ICT — Asian/London/NY (Big Sal Trades)Description:
This tool automatically tracks session or timeframe highs and lows, plots them on your chart, and removes them instantly when price sweeps or touches them — so you never deal with stale levels again.
⸻
Core Features
• Dynamic High/Low Plotting – Color-coded lines for multiple sessions or timeframes.
• Touch-to-Delete – Levels are deleted automatically when price touches or breaks them.
• Lookback Pruning – Remove old levels after a set number of bars/days.
• Multi-Timeframe Support – Works on intraday and higher timeframes.
• Custom Sensitivity – Choose tick buffer, wick vs close confirmation, and session types.
• No Repainting – Updates in real time, keeps your chart accurate.
⸻
Settings Instructions
Session Selection
• Toggle Asia, London, NY or other sessions you want to track.
Delete on Touch Settings
• Confirm Type:
• Wick – Delete as soon as price wick touches/breaks the level.
• Close – Delete only if candle closes beyond the level.
• Confirm Ticks:
• 0 – Instant deletion on touch.
• 1–2+ – Require price to exceed by this many ticks before deletion.
Lookback Settings
• Max Days/Bars: Remove levels older than this period.
Line Style Settings
• Customize color, style, and width for each session/timeframe to keep charts organized.
⸻
Tip:
Use a small tick confirmation for fast-moving markets like NASDAQ, and larger confirmation for slower assets. Combine with liquidity zones, order blocks, or SMC concepts for powerful trade confluence.
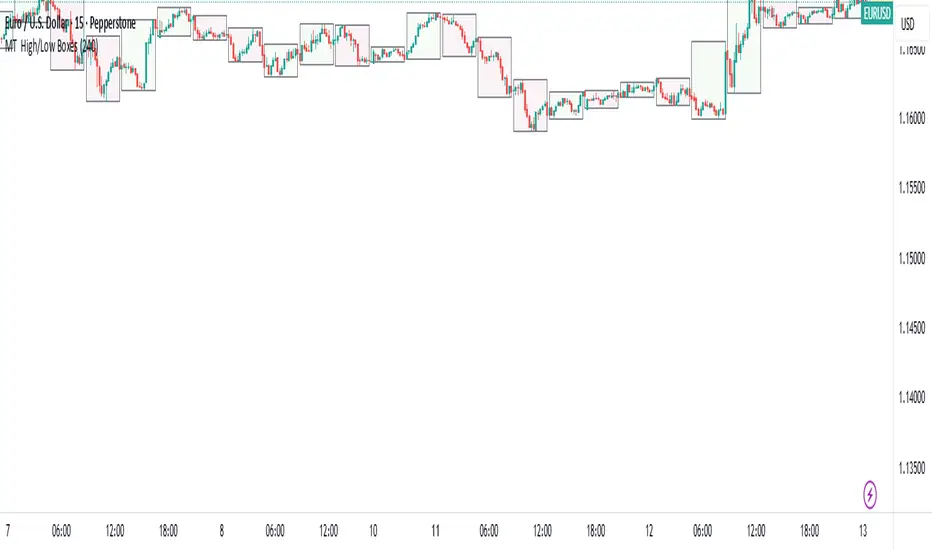
MT High/Low Boxes"Box out the High/Low at User-Defined Time Frame"
This feature allows users to set a custom time frame via an input panel, following TradingView's time frame conventions (e.g., "60," "240," "D," etc.).
The script dynamically captures timestamps for each custom interval to detect the start of new segments.
The box width is calculated based on the number of bars within the custom time frame, ensuring accurate coverage of the corresponding time range.
A central dashed line (yellow dotted) reflects the real-time midpoint between the high and low of the interval.
The background color adjusts based on bullish/bearish bias, comparing the opening price to the current closing price.
Simply select your desired time frame in the indicator settings—flexible and compatible with multiple time frames, including non-minute/hour units (e.g., daily, weekly).
915 Candle High/Low RaysDraws horizontal rays from the high and low of the first 5-minute candle for any selected date in the NSE equity session (09:15–15:30). Features include:
- Date picker for any trading day (defaults to today, exchange timezone)
- Session-limited rays (do not extend past the session end)
- Option to project levels to all timeframes
- Customizable ray style, label display, and color
- Optional breakout alerts for high/low crossing
- Designed for Indian markets and any NSE equity symbol

Sessions and High/Low/andrewSessions and High/Low/andrew
this indictors covers all the session high and low including frankfurt

Daily High/Low Close Breakout - GOLD### **Daily High/Low Close Breakout Indicator**
This indicator is a powerful tool for identifying potential breakout opportunities based on the previous day's price action. It's built on a unique time-based logic that defines key support and resistance levels for the trading day.
---
### **How the Indicator Works**
The indicator operates in two main phases:
1. **Calculation Period (00:00 to 16:30 Tehran Time):** The indicator first observes the price action from the start of the day until 16:30. During this time, it records the highest and lowest **closing prices** of all candles. The chart background is shaded gray to visually mark this period.
2. **Trading Period (16:30 to 16:30 the next day):** At 16:30, the highest and lowest close levels are finalized and drawn as horizontal lines. These levels then become the primary breakout zones for the next 24 hours. The indicator will generate signals whenever the price crosses these lines.
---
### **Trading Signals**
The indicator uses a simple and effective crossover logic for its signals:
* **BUY Signal:** A signal is generated when a candle's closing price **crosses above** the high close line.
* **SELL Signal:** A signal is generated when a candle's closing price **crosses below** the low close line.
---
### **Important Usage Guidelines**
For optimal performance, please follow these specific recommendations:
* **Timeframe:** This indicator is designed and optimized to be used exclusively on the **15-minute timeframe**. Using it on other timeframes may produce inconsistent or unreliable results.
* **Primary Asset:** The logic for this indicator was developed and backtested primarily for **Gold (XAUUSD)**. Its performance and win rate have been observed to be the most consistent on this asset.
* **Asset Restriction:** It is strongly recommended to **avoid using this indicator on other currency pairs or assets**, as it has not been optimized for their specific market behavior.
---
### **Disclaimer**
*This indicator is provided for informational and educational purposes only. It is not financial advice. Past performance is not a guarantee of future results. All trading decisions should be based on your own research and risk analysis. Always use proper risk management.*

QT NY Session High/LowShows Asia & London High/Low which are key liquidity points price will react to.
You can also adjust the NY AM 6am - 12pm EST range to divide the time frames into 4 quarters
It delivers NY AM true open and the true day open
It gives you previous day high & previous day low

Advanced Swing High/Low Trend Lines with MA Filter# Advanced Swing High/Low Trend Lines Indicator
## Overview
This advanced indicator identifies and draws trend lines based on swing highs and lows across three different timeframes (large, middle, and small trends). It's designed to help traders visualize market structure and potential support/resistance levels at multiple scales simultaneously.
## Key Features
- *Multi-Timeframe Analysis*: Simultaneously tracks trends at large (200-bar), middle (100-bar), and small (50-bar) scales
- *Customizable Visualization*: Different colors, widths, and styles for each trend level
- *Trend Confirmation System*: Requires minimum consecutive pivot points to validate trends
- *Trend Filter Option*: Can align trends with 200 EMA direction for consistency
## Recommended Settings
### For Long-Term Investors:
- Large Swing Length: 200-300
- Middle Swing Length: 100-150
- Small Swing Length: 50-75
- Enable Trend Filter: Yes
- Confirmation Points: 4-5
### For Swing Traders:
- Large Swing Length: 100
- Middle Swing Length: 50
- Small Swing Length: 20-30
- Enable Trend Filter: Optional
- Confirmation Points: 3
### For Day Traders:
- Large Swing Length: 50
- Middle Swing Length: 20
- Small Swing Length: 5-10
- Enable Trend Filter: No
- Confirmation Points: 2-3
## How to Use
### Identification:
1. *Large Trend Lines* (Red/Green): Show major market structure
2. *Middle Trend Lines* (Purple/Aqua): Intermediate levels
3. *Small Trend Lines* (Orange/Blue): Short-term price action
### Trading Applications:
- *Breakout Trading*: Watch for price breaking through multiple trend lines
- *Bounce Trading*: Look for reactions at confluence of trend lines
- *Trend Confirmation*: Aligned trends across timeframes suggest stronger moves
### Best Markets:
- Works well in trending markets (forex, indices)
- Effective in higher timeframes (1H+)
- Can be used in ranging markets to identify boundaries
## Customization Tips
1. For cleaner charts, reduce line widths in congested markets
2. Use dotted styles for smaller trends to reduce visual clutter
3. Adjust confirmation points based on market volatility (higher for noisy markets)
## Limitations
- May repaint on current swing points
- Works best in trending conditions
- Requires sufficient historical data for longer swing lengths
This indicator provides a comprehensive view of market structure across multiple timeframes, helping traders make more informed decisions by visualizing the hierarchy of support and resistance levels.

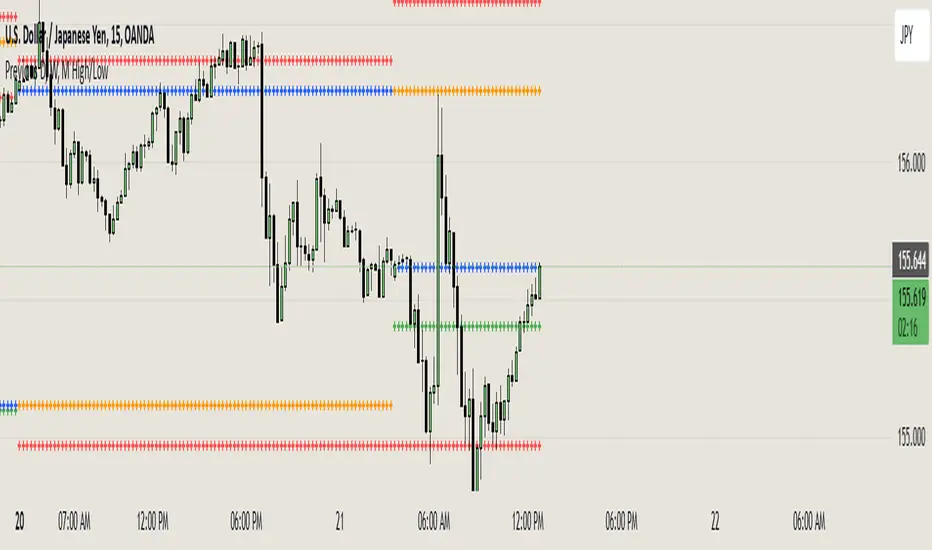
Previous D, W, M High/LowThis indicator plots previous day's high,low,open and close values and plots previous week's and month's high and low value on the chart.
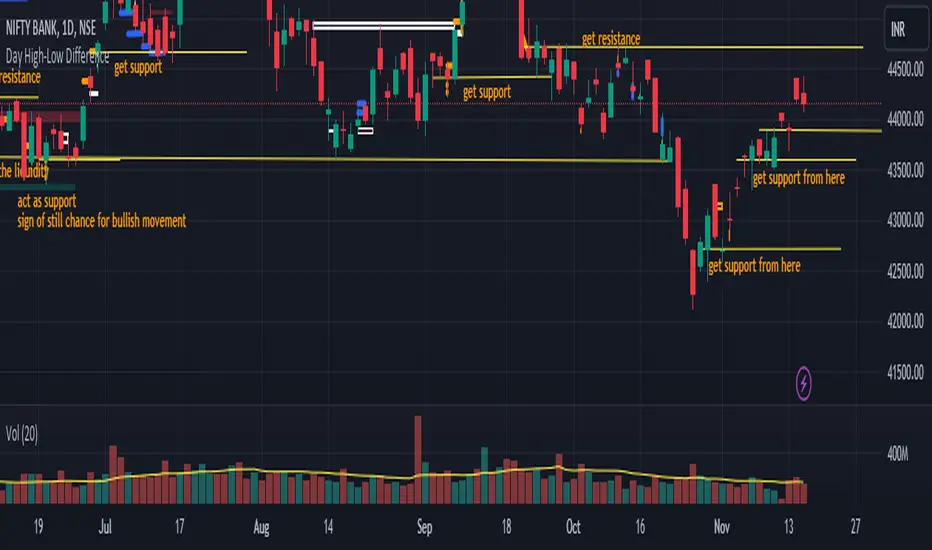
Day High-Low Difference ( The one trader )The "Day High-Low Difference" candle tool is an indicator that calculates and visually represents the difference between the highest price (day high) and the lowest price (day low) within each candle on a given chart. This tool is useful for traders and analysts to quickly assess the volatility or range of price movement within individual candles.
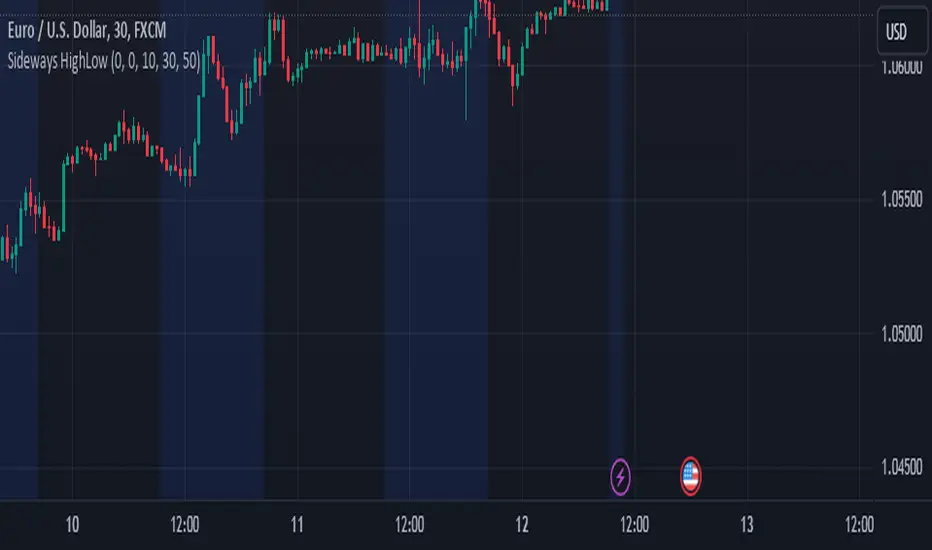
Sideways Market Detector with High/Low NJRCalculate the range as the difference between the high and low prices.
The maxRange input to specify the maximum allowable range that defines a sideways market.
The background color is set to blue during sideways market conditions, and it's transparent to some extent (transp=90). When the market is not sideways, the background color is not changed.
The indicator marks the start and end of the session with red triangles.
When the price range (high - low) is within the specified threshold, the indicator will indicate a sideways market with a blue background.
YDH/YDL to Current Day H/L - Zones- Draw boxes on the intersections between yesterday's high/low and the day's after high/low
This will help you to visualize areas at extreme points where algo hasn't yet pushed price to recover them

Asymmetric Dispersion High Lowdear fellows,
this indicator is an effort to determine the range where the prices are likely to fall within in the current candle.
how it is calculated
1. obtain
a. gain from the open to the high
b. loss from the open to the low
in the last 20 (by default) candles and
in the last 200 (10*20 by default) candles
2. perform
a. the geometric average (sma of the log returns) over these gains and losses
b. their respective standard deviation
3. plot from the open of each candle
a. the average + 2 standard deviations (2 by default) of the short window size
b. same for the long window size (which is overlapped)
what it shows
1. where the current candle is likely to move with 95% likelyhood
how it can be interpreted
1. a gauge for volatility in the short and long term
2. a visual inbalance between likelyhood to go up or down according to dispersion in relation to current prices or candle open.
3. a confirmation of crossings of, for instance, support and resistances once the cloud is completely above or below.
in regard to bollinger bands (which are and excellent well proven indicator)
1. it segregates upward moves from the downward ones.
2. it is hardly crossed by prices
3. it is centered on the current candle open, instead of the moving average.
we welcome feedback and critic.
best regards and success wishes.

Mondays Range by B1rdPlots mondays range (high, low and optionally average)
Features:
Added the option to extend the range for the entire week or just monday
Added the option to display if the high or low of the range has been taken and removes the level aftwards
Added the option to only display the current week
Added the option to visualize new weekly sessions
Added the option to mark mondays with a seperate background
Will update the script based on suggestions

DKNS_Daily Weekly Monthly High Low Open CloseDKNS_Daily Weekly Monthly High Low Open Close, it will give daily weekly monthly high low close open

Previous High/Low LevelsPrevious High/Low Levels
Select 5 Custom Timeframes to display the previous High and Low levels on your chart.
NOTE: For Levels to work correctly and for price labels to be displayed, Right-click chart background -> select Settings -> select Scales -> tick “Indicator Last Value Label".
Once indicator has been added open settings and select timeframe, color, labels, offset parameters and line style as desired then SAVE.
Handy when using The Strat.

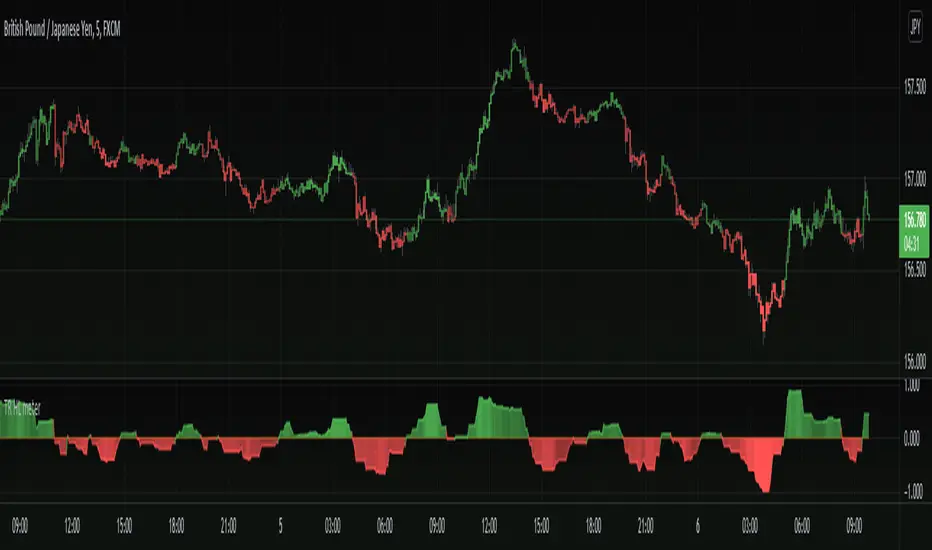
TR High/Low meterInteresting take for a velocity and trend analysis indicator, I call it The TR high/low meter.
First it will find the highest high and lowest low based on X bars back.
Now comes the twist, instead of storing these lowest or highest prices, we store the TR (true range) into the appropriate array (one array for lowest and one array for highest).
Finally, we sum up these two arrays for highest TR's and lowest TR's and subtract each other to get the difference, Hench, see who is stronger.
In the end we plot the difference into the indicator we have here.
The plot is colored with gradient color in which bright color emphasizes the movement is strong and weaker color emphasizes the movement is getting weaker.
Basically this indicator shows us the asset trend direction and strength. Awesome!
==Colors and Bar Colors==
Green: Up Trending
Light Green: Weakening up trend
Red: Down Trending.
Light Red: Weakening Down Trending.
==Notes==
Bar coloring is enabled on this chart!
Supports EMA smoothing (disabled by default)
Like if you like and Enjoy! Follow for more upcoming indicators/strategies: www.tradingview.com
52 Weeks High/Low WidgetSome time ago I published my "All-Time High/Low Widget". I was asked to build and 52w weeks version.
So finally it's ready. It works pretty much the same way but uses a time period only of 52weeks.
You can also change the number of weeks in the parameters.
You can plot the levels and display some stats when 52W high/low happened and how far away are we at this moment.
Also, you can create alerts to get notified on 52W levels breakouts.
Disclaimer
Please remember that past performance may not be indicative of future results.
Due to various factors, including changing market conditions, the strategy may no longer perform as well as in historical backtesting.
This post and the script don’t provide any financial advice.
